CORIOLIX
Cruise Observations
Real-time Interface &
Open Live Information eXchange
SCIENCE FROM SHIP TO SHORE
A real-time system supporting oceanographic research
real-time data access & visualization
maintenance and event logs
quality controlled data
remote participation
notification services
Where to start?
|
Sensor Status
Monitor sensor systems for real-time state of health
|
|
Time-series
View real-time data from shipboard sensors
|
|
Map
Visualize underway data on a map; review and plan cruise tracks
|
|
Create Account Create & manage your account |
|
Data Access
Access real-time data and data products via download or 3rd party client tools
|
|
Documents
Catalog and explore manuals, calibration files, and other metadata
|
Remote Participation
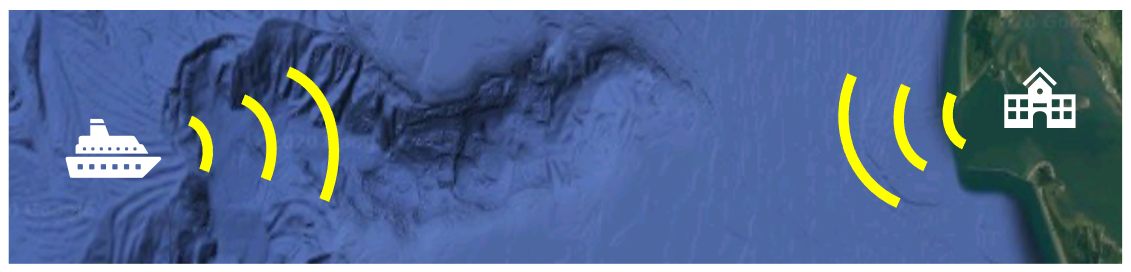
CORIOLIX provides real-time access to data and tools on both ship and shore. Shoreside users see the same data, plots and tools as the science party on the vessel. Changes to logs and metadata are automatically copied from ship to shore and vice versa. Shoreside access allows remote participation by scientists on shore, data quality control by sensor specialists, and public access to data and tools for outreach and education.
Real-Time Data Visualization
Time-series Plots & Gauges
Interactive plots display data from the onboard flowthrough, meteorological, and navigation sensors. Users may also create custom plots of chosen parameters.
Mapping Tools
The current vessel location and vessel track is displayed on an interactive map. Tools available include map overlays (such as geography, bathymetry, satellite data, and model data), route planning, station and asset locations, and data collected by the ship sensors along the track.
Data Access
Preliminary data are available for access anytime during a cruise.
Access to
native sensor resolution data and
temporally binned data is provided.
Downloads may be customized by date range, parameter, temporal resolution, and file format.
Data and metadata are also accessible in near real-time through a RESTful API and an ERDDAP server.
After each cruise, the data are archived with the Rolling Deck to Repository (R2R) program.
Data and metadata are also accessible in near real-time through a RESTful API and an ERDDAP server.
After each cruise, the data are archived with the Rolling Deck to Repository (R2R) program.
Science Party Tools
CORIOLIX provides tools to help with cruise planning, situational awareness, and event recording.
Cruise information such as dates, ports, and participant lists are provided.
An event log allows the science party, on ship or shore, to record cruise-related activity such as CTD casts.
Customizable alerts notify registered users when conditions are met, such as arriving on station.
Cruise information such as dates, ports, and participant lists are provided.
An event log allows the science party, on ship or shore, to record cruise-related activity such as CTD casts.
Customizable alerts notify registered users when conditions are met, such as arriving on station.
System Health
The status of the data from each sensor is continuously monitored for availability and quality.
Automated quality flags, such as "outside expected global limits", are applied to every data value.
Technicians on the vessel or shore may subscribe to alerts such as data status notifications and calibration and maintenance reminders.
Sensor logs record the sensor history and configuration.
Automated quality flags, such as "outside expected global limits", are applied to every data value.
Technicians on the vessel or shore may subscribe to alerts such as data status notifications and calibration and maintenance reminders.
Sensor logs record the sensor history and configuration.
Sensor Information
Detailed information about each sensor is provided on individual sensor pages.
A complete list of parameters and their associated metadata is readily accessible to all users.
Technicians on ship or shore may update this information at any time.
A simple sensor log records issues, configuration changes, and calibration dates.
Documentation, such as user guides, may be hosted on CORIOLIX for fast retrieval.
A simple sensor log records issues, configuration changes, and calibration dates.
Documentation, such as user guides, may be hosted on CORIOLIX for fast retrieval.
Outreach & Education
In concert with other remote participation technologies, such as live video feeds, CORIOLIX provides the data access and exploration tools to support an immersive experience for students and the general public.
Near real-time data streams, interactive plots and maps, and easy data access enable remote participation in research cruises from anywhere around the globe.