Overview
The RCRV Datapresence System was developed to include robust data access tools for multiple types of users including website users, web clients, and 3rd party data analysis and visualization packages). This guide will help users identify the most appropriate way to access data from CORIOLIX, given their requirements, and provide examples to get users started.
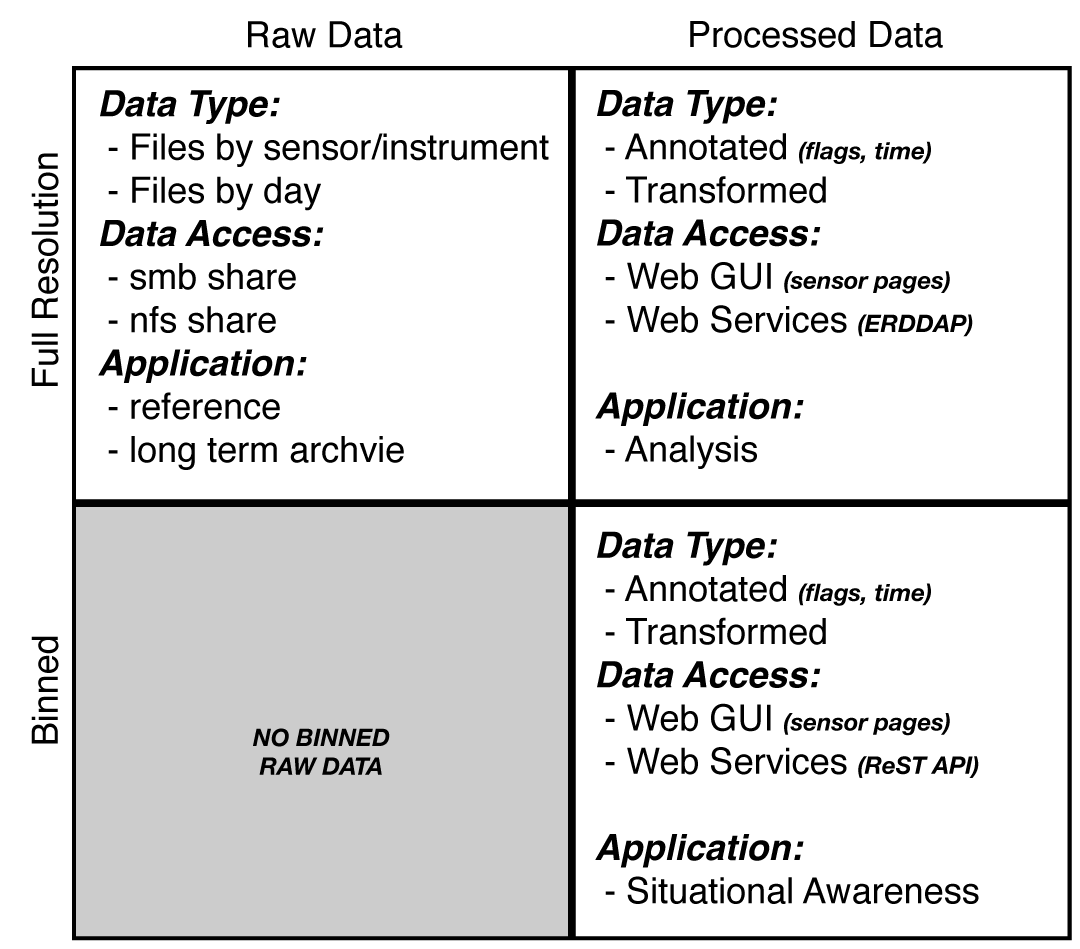
NOTE: Please review the information avaiable under Data Structure section to ensure that you are understand how data is managed in CORIOIX before moving on.
Accessing the RCRV Datapresence System with 3rd Party Clients
for 3rd party data analysis and visualization clients such as, but not limited to: Matlab, R, and ArcGIS. The following tutorials provide a quick overview of how to connect to the RCRV Datapresence "Data Store" using the ArcGIS and R software packages.
ArcGIS 10.4
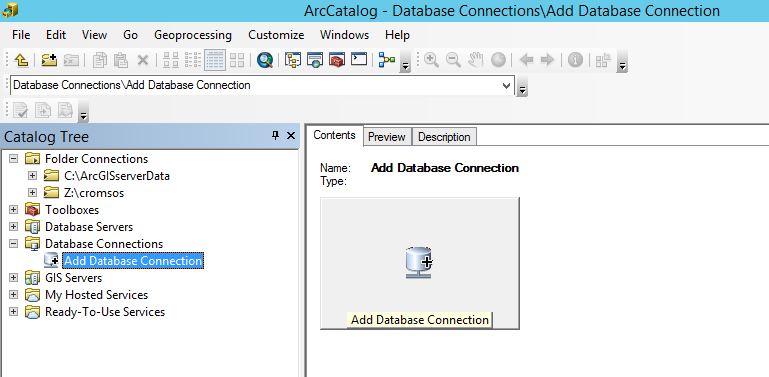
The first step in accessing the RCRV Data Store is to launch ArcCatalog where you'll create a Database Connection to the RCRV database on the ship's public network. Expand Database Connections and double click on +Add Database Connection.
Step two is to set the Database Connection parameters. The IP address and password should be requested from your Marine Technician.
| Database Platform | PostgreSQL |
| Instance | enter the IP address of the public database server |
| Authentication Type | Database authentication |
| User name | rcrv_pub |
| Password | enter the password |
| Save user name and password | checked |
| Database | gui_db |
Click OK when you've completed the database setup.
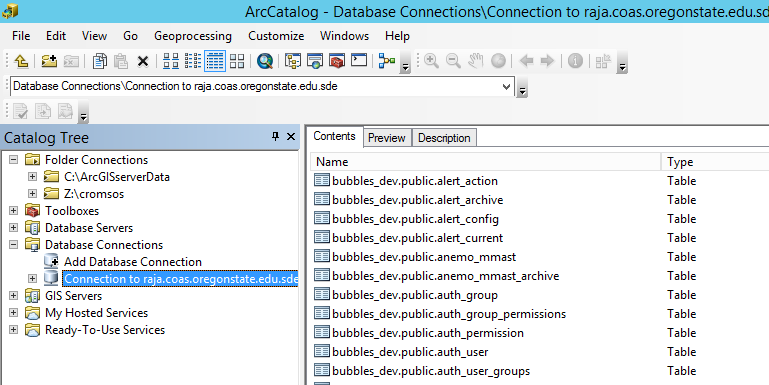
You should now have a new entry available under Database Connections in your Catalog Tree. Click on "Connection to XXXXX" to view the contents of the database. Database resources follow the database.schema.table naming convention.
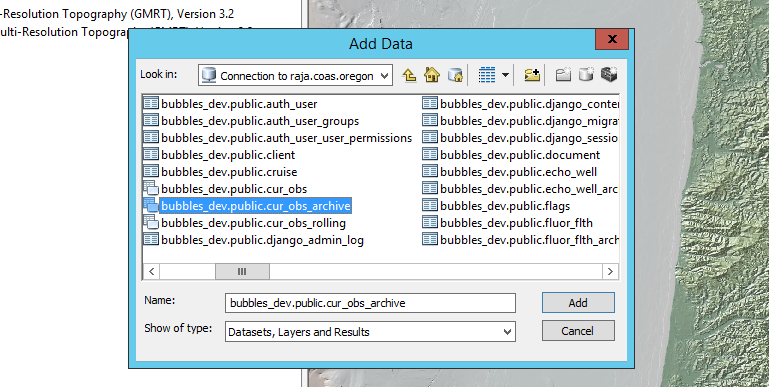
To add data to a map document for view and analysis from ArcMap select +AddData. From the Add Data gui select the "Connection to XXXXX" as the source (Look in). Note that the icon type for each dataset can discern the difference between tabular data with and tabular data without spatial coordinates. Tabular data without spatial coordinates have simple table like icons. Tabular data with spatial coordinates have icons with a table and point graphic (as in graphic below).
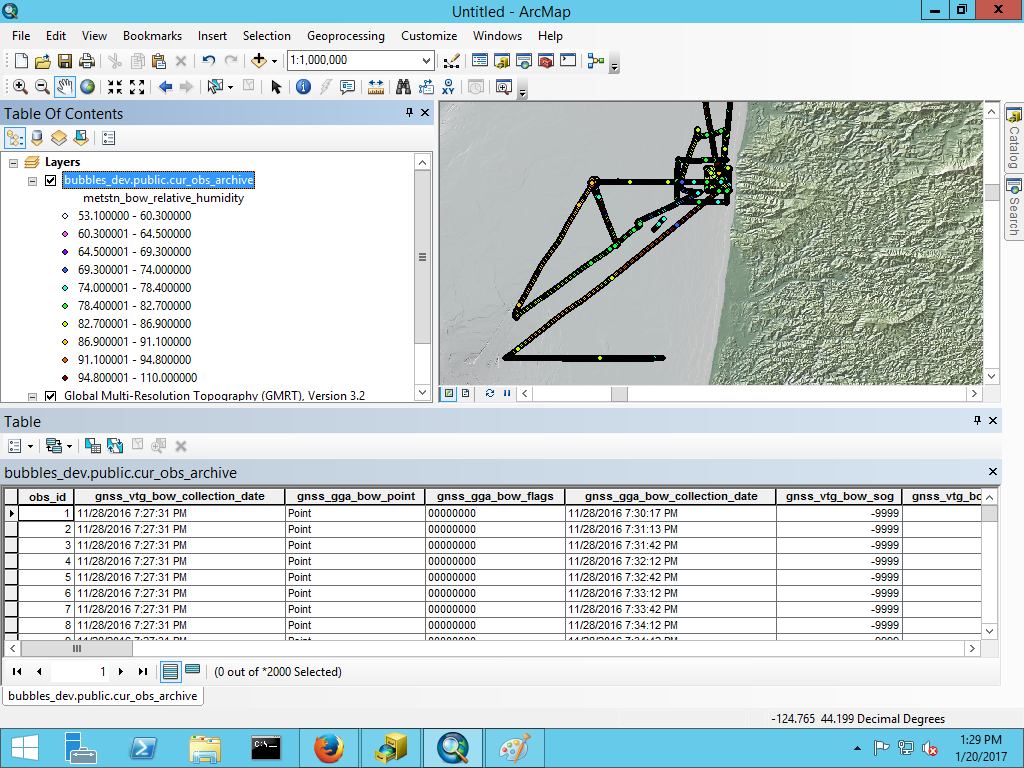
This final graphic shows the results of successfully adding a dataset to an existing map document!
R
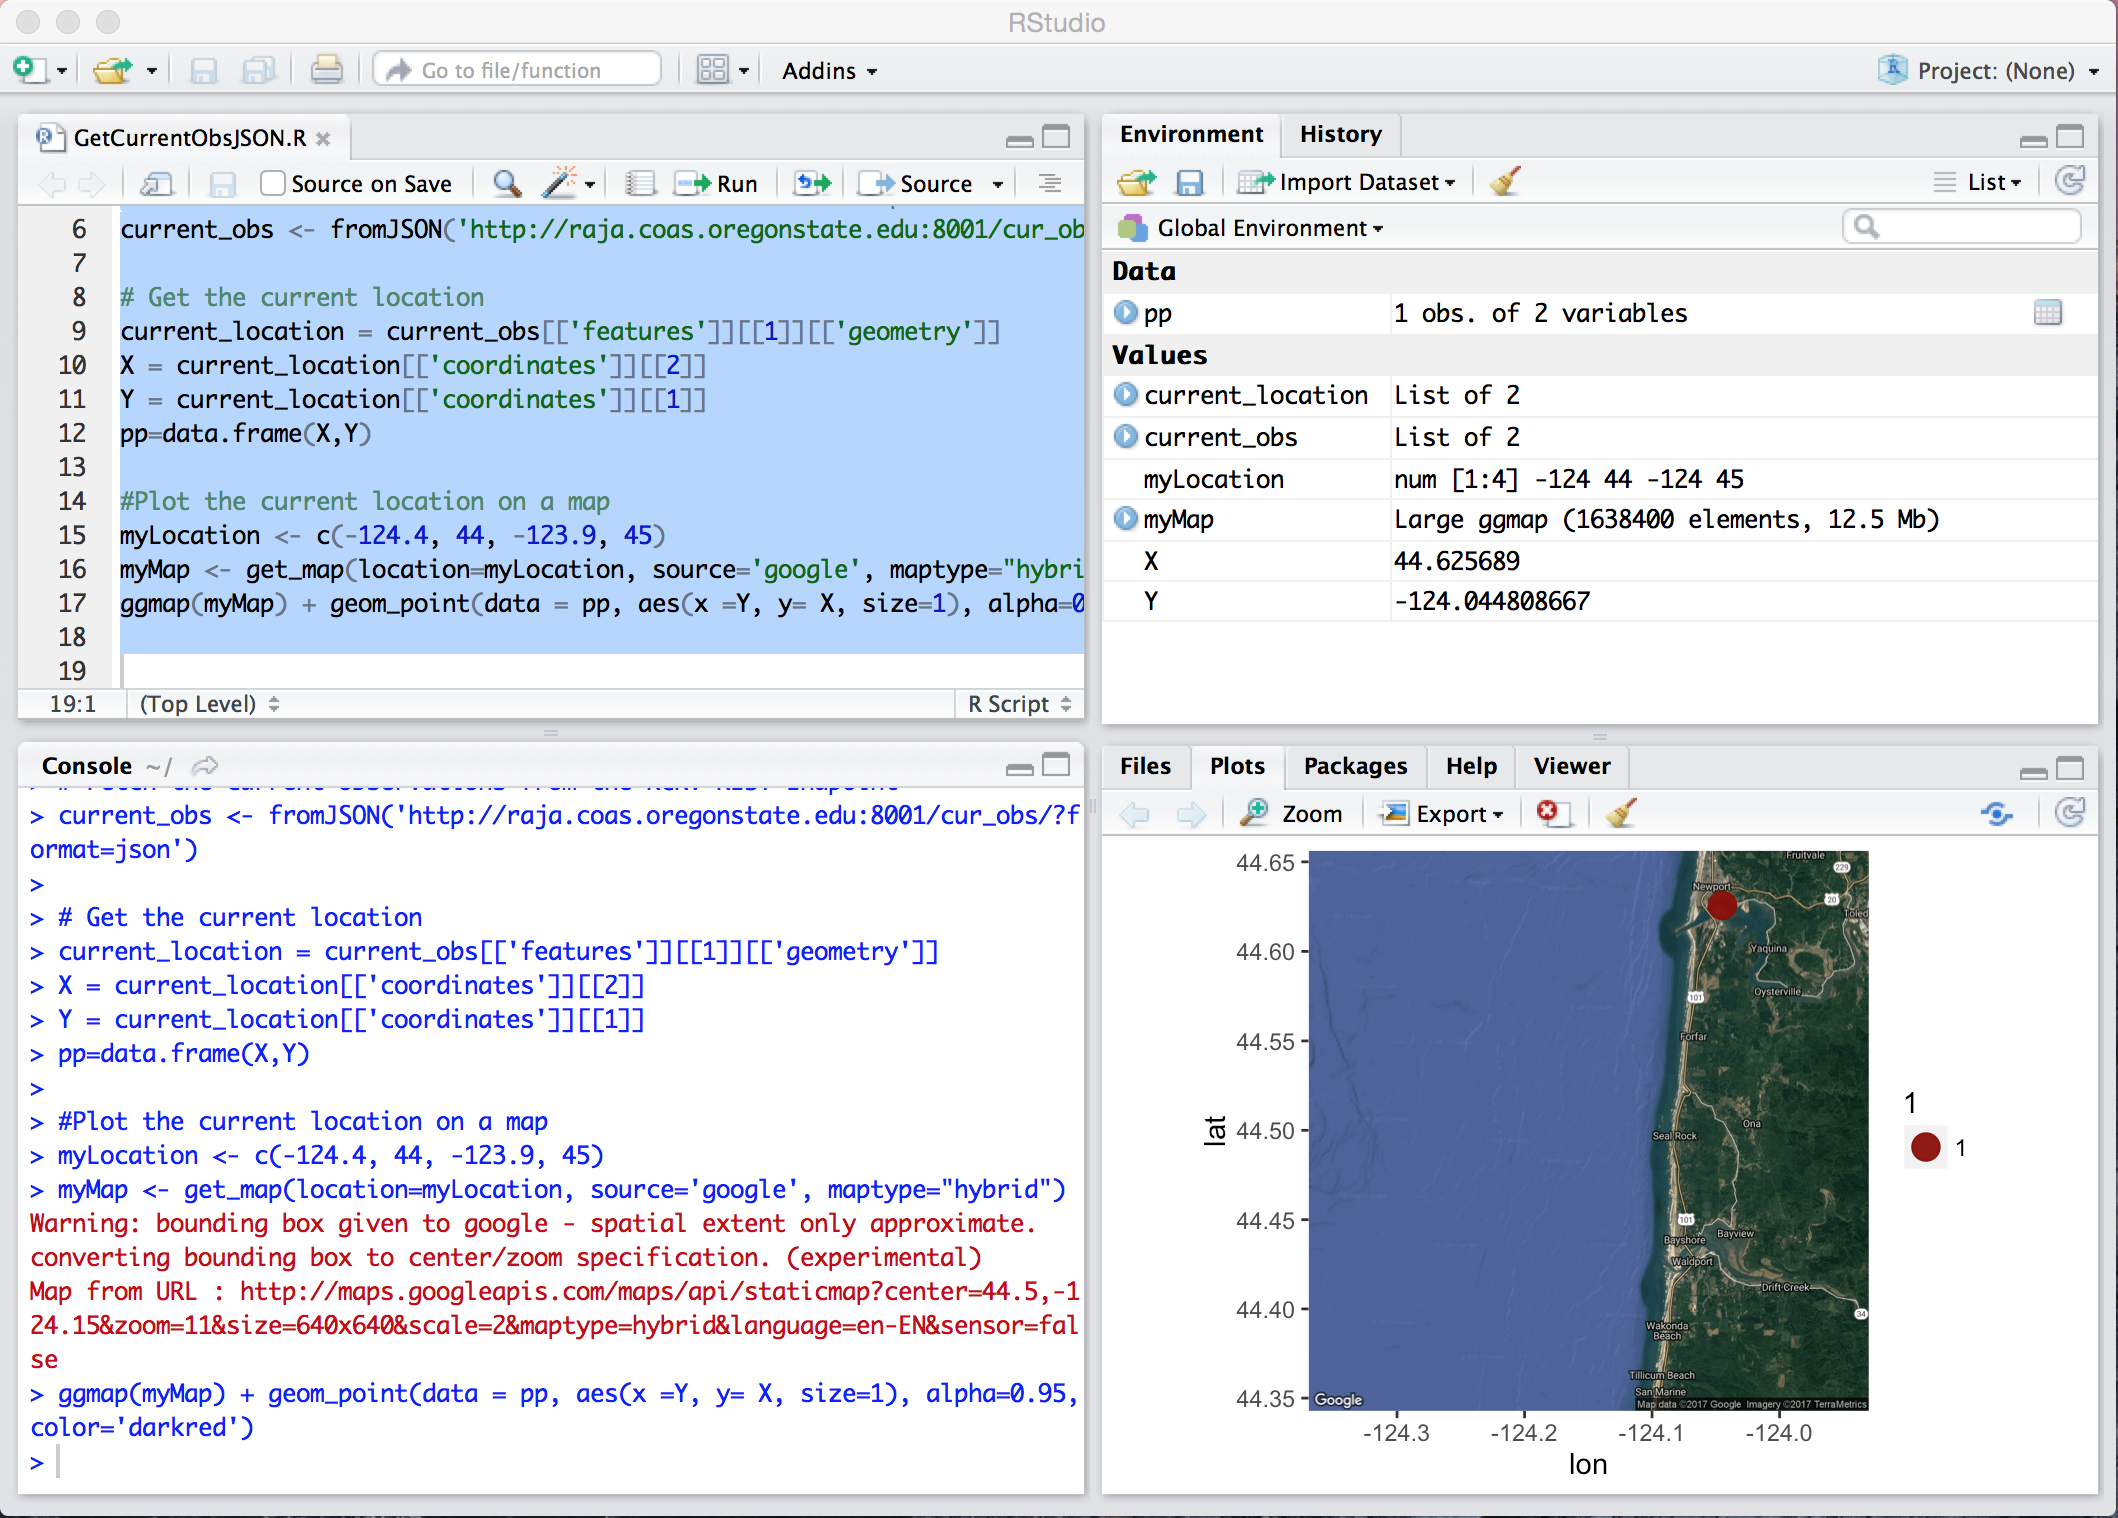
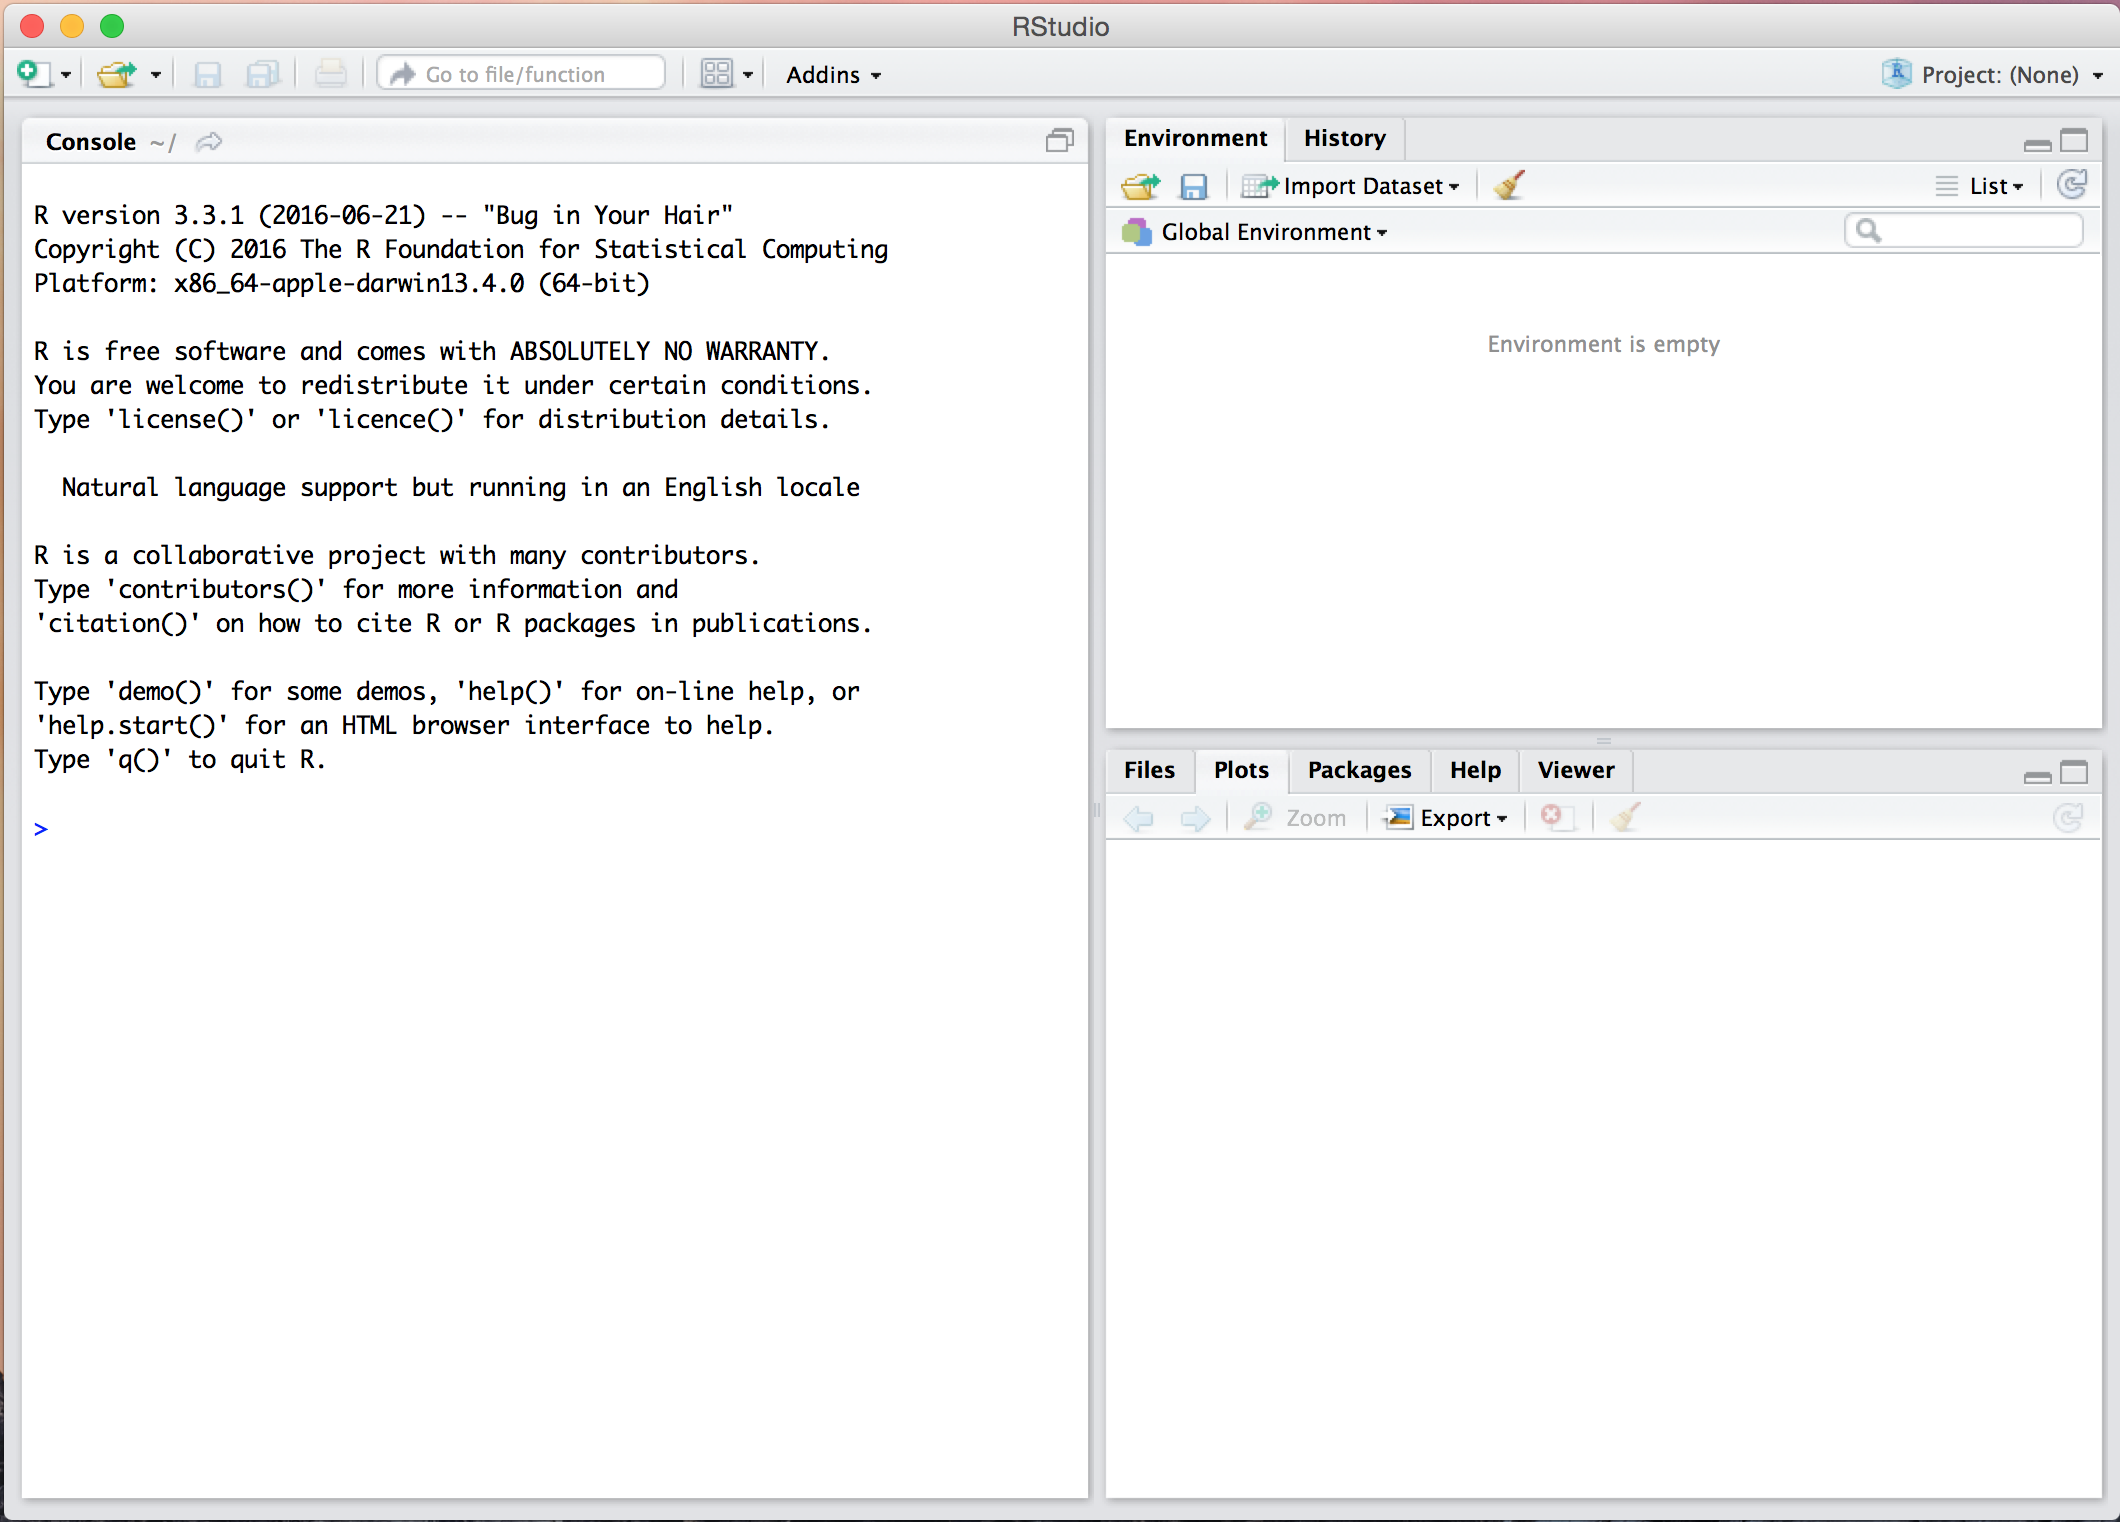
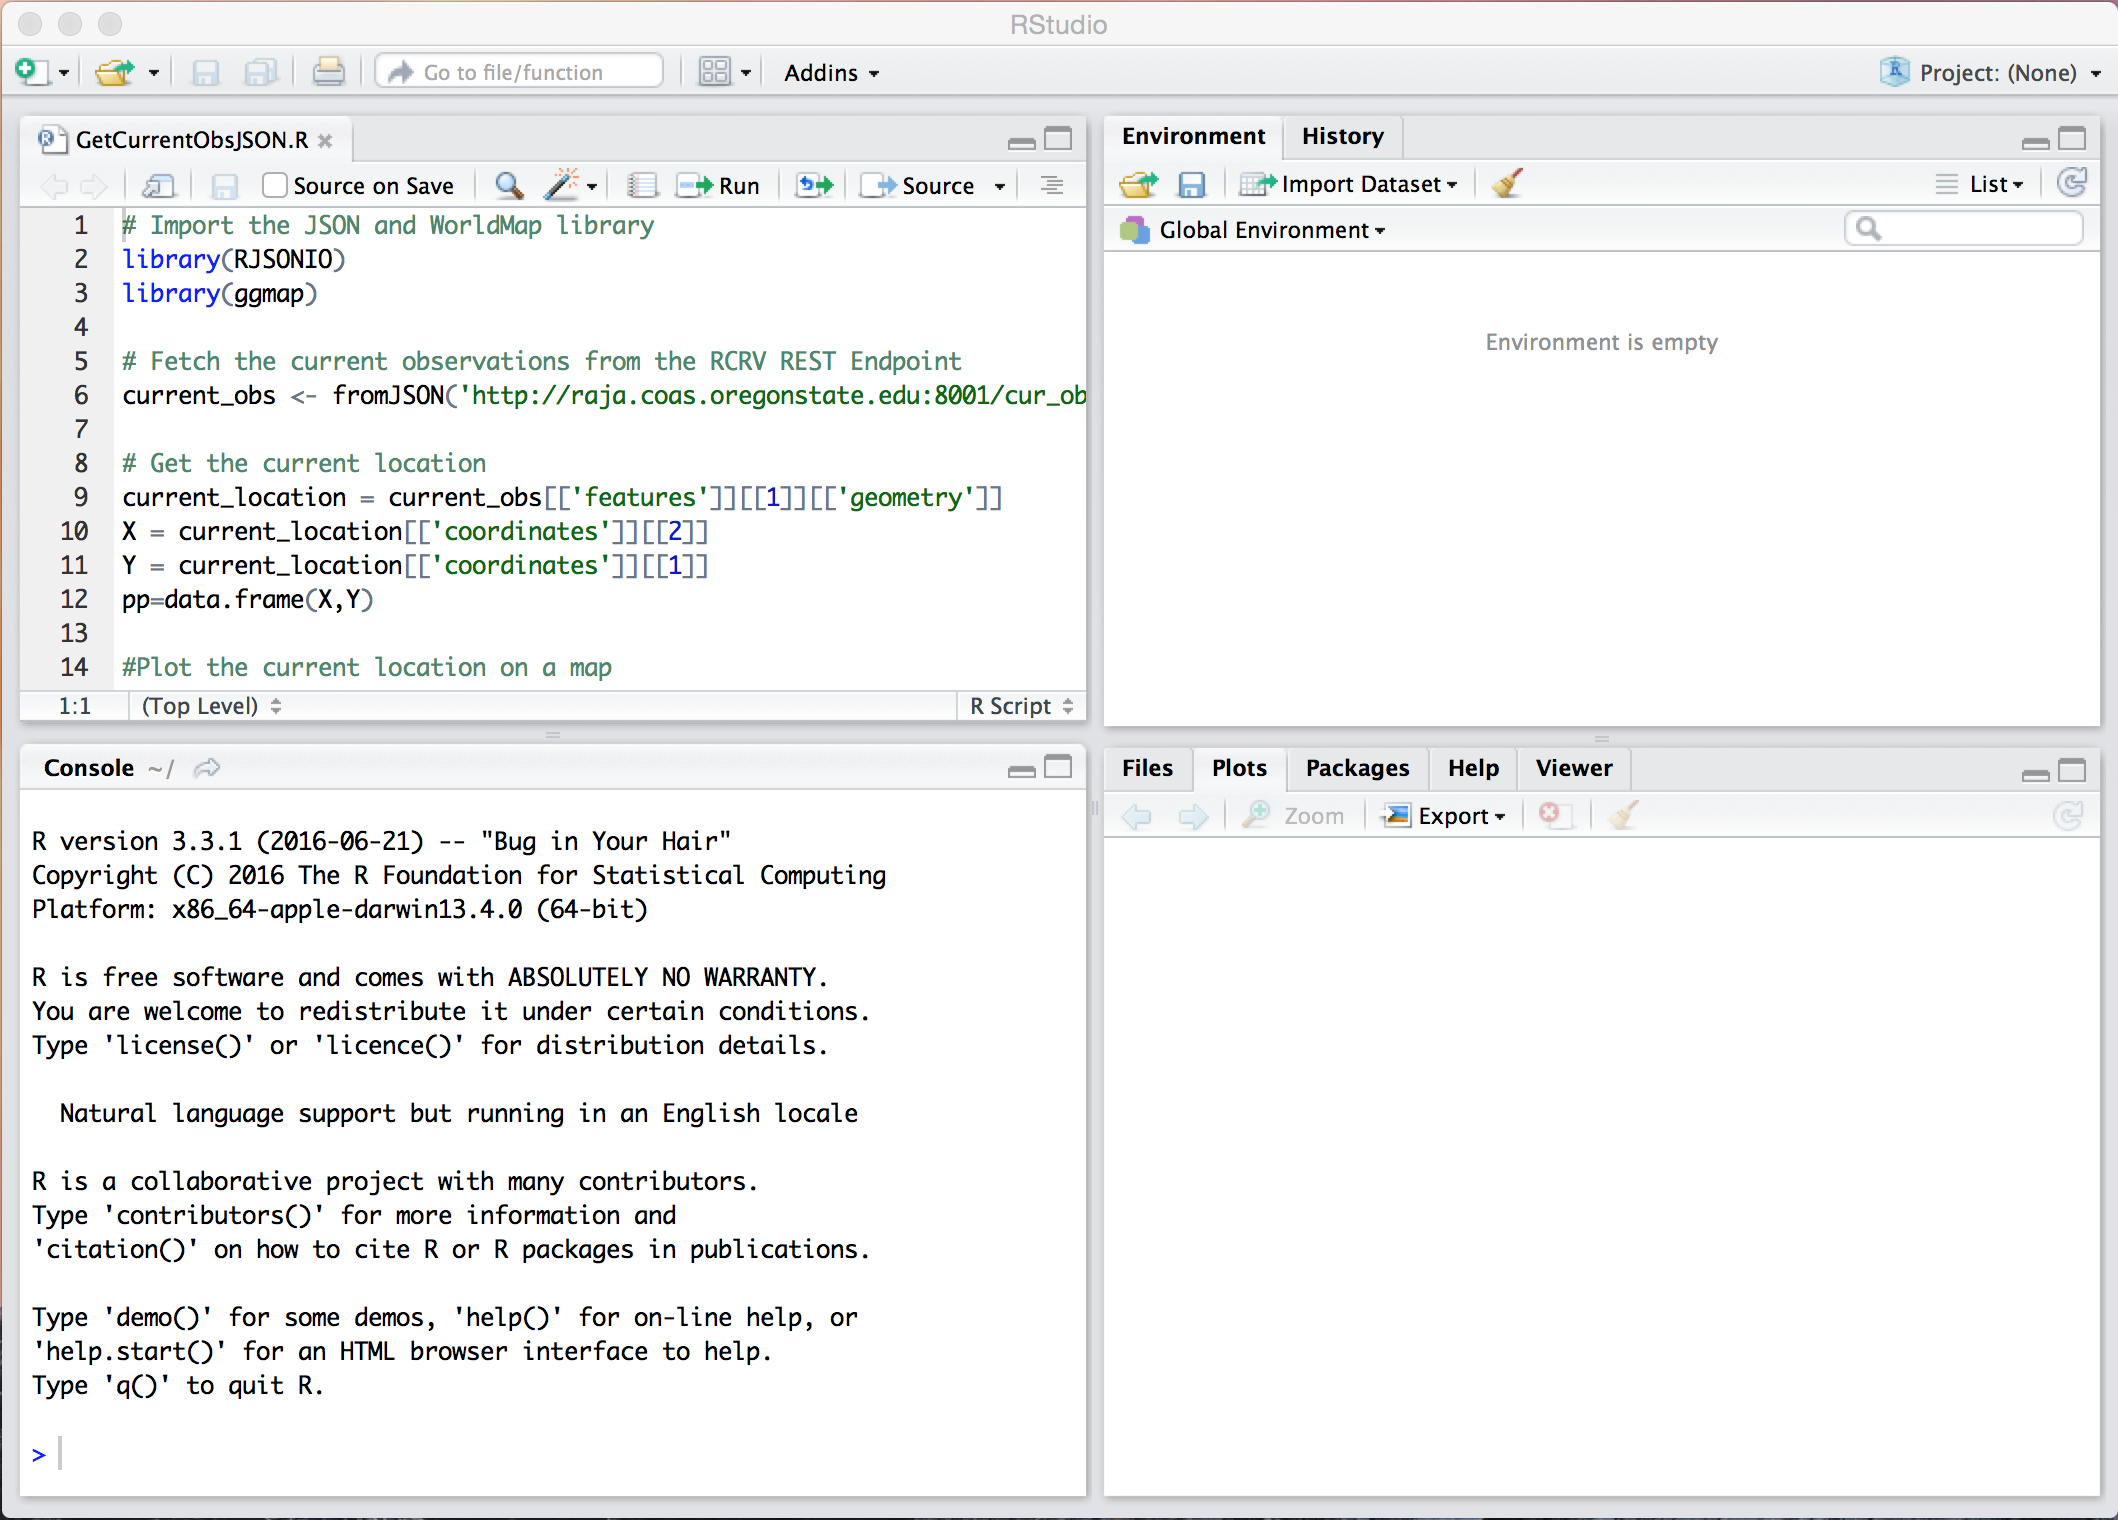
The following data access example utilizes the open-source RStudio user interface (https://www.rstudio.com/). You should be able to easily adapt the data access example here to other R interfaces.
Open RStudio.
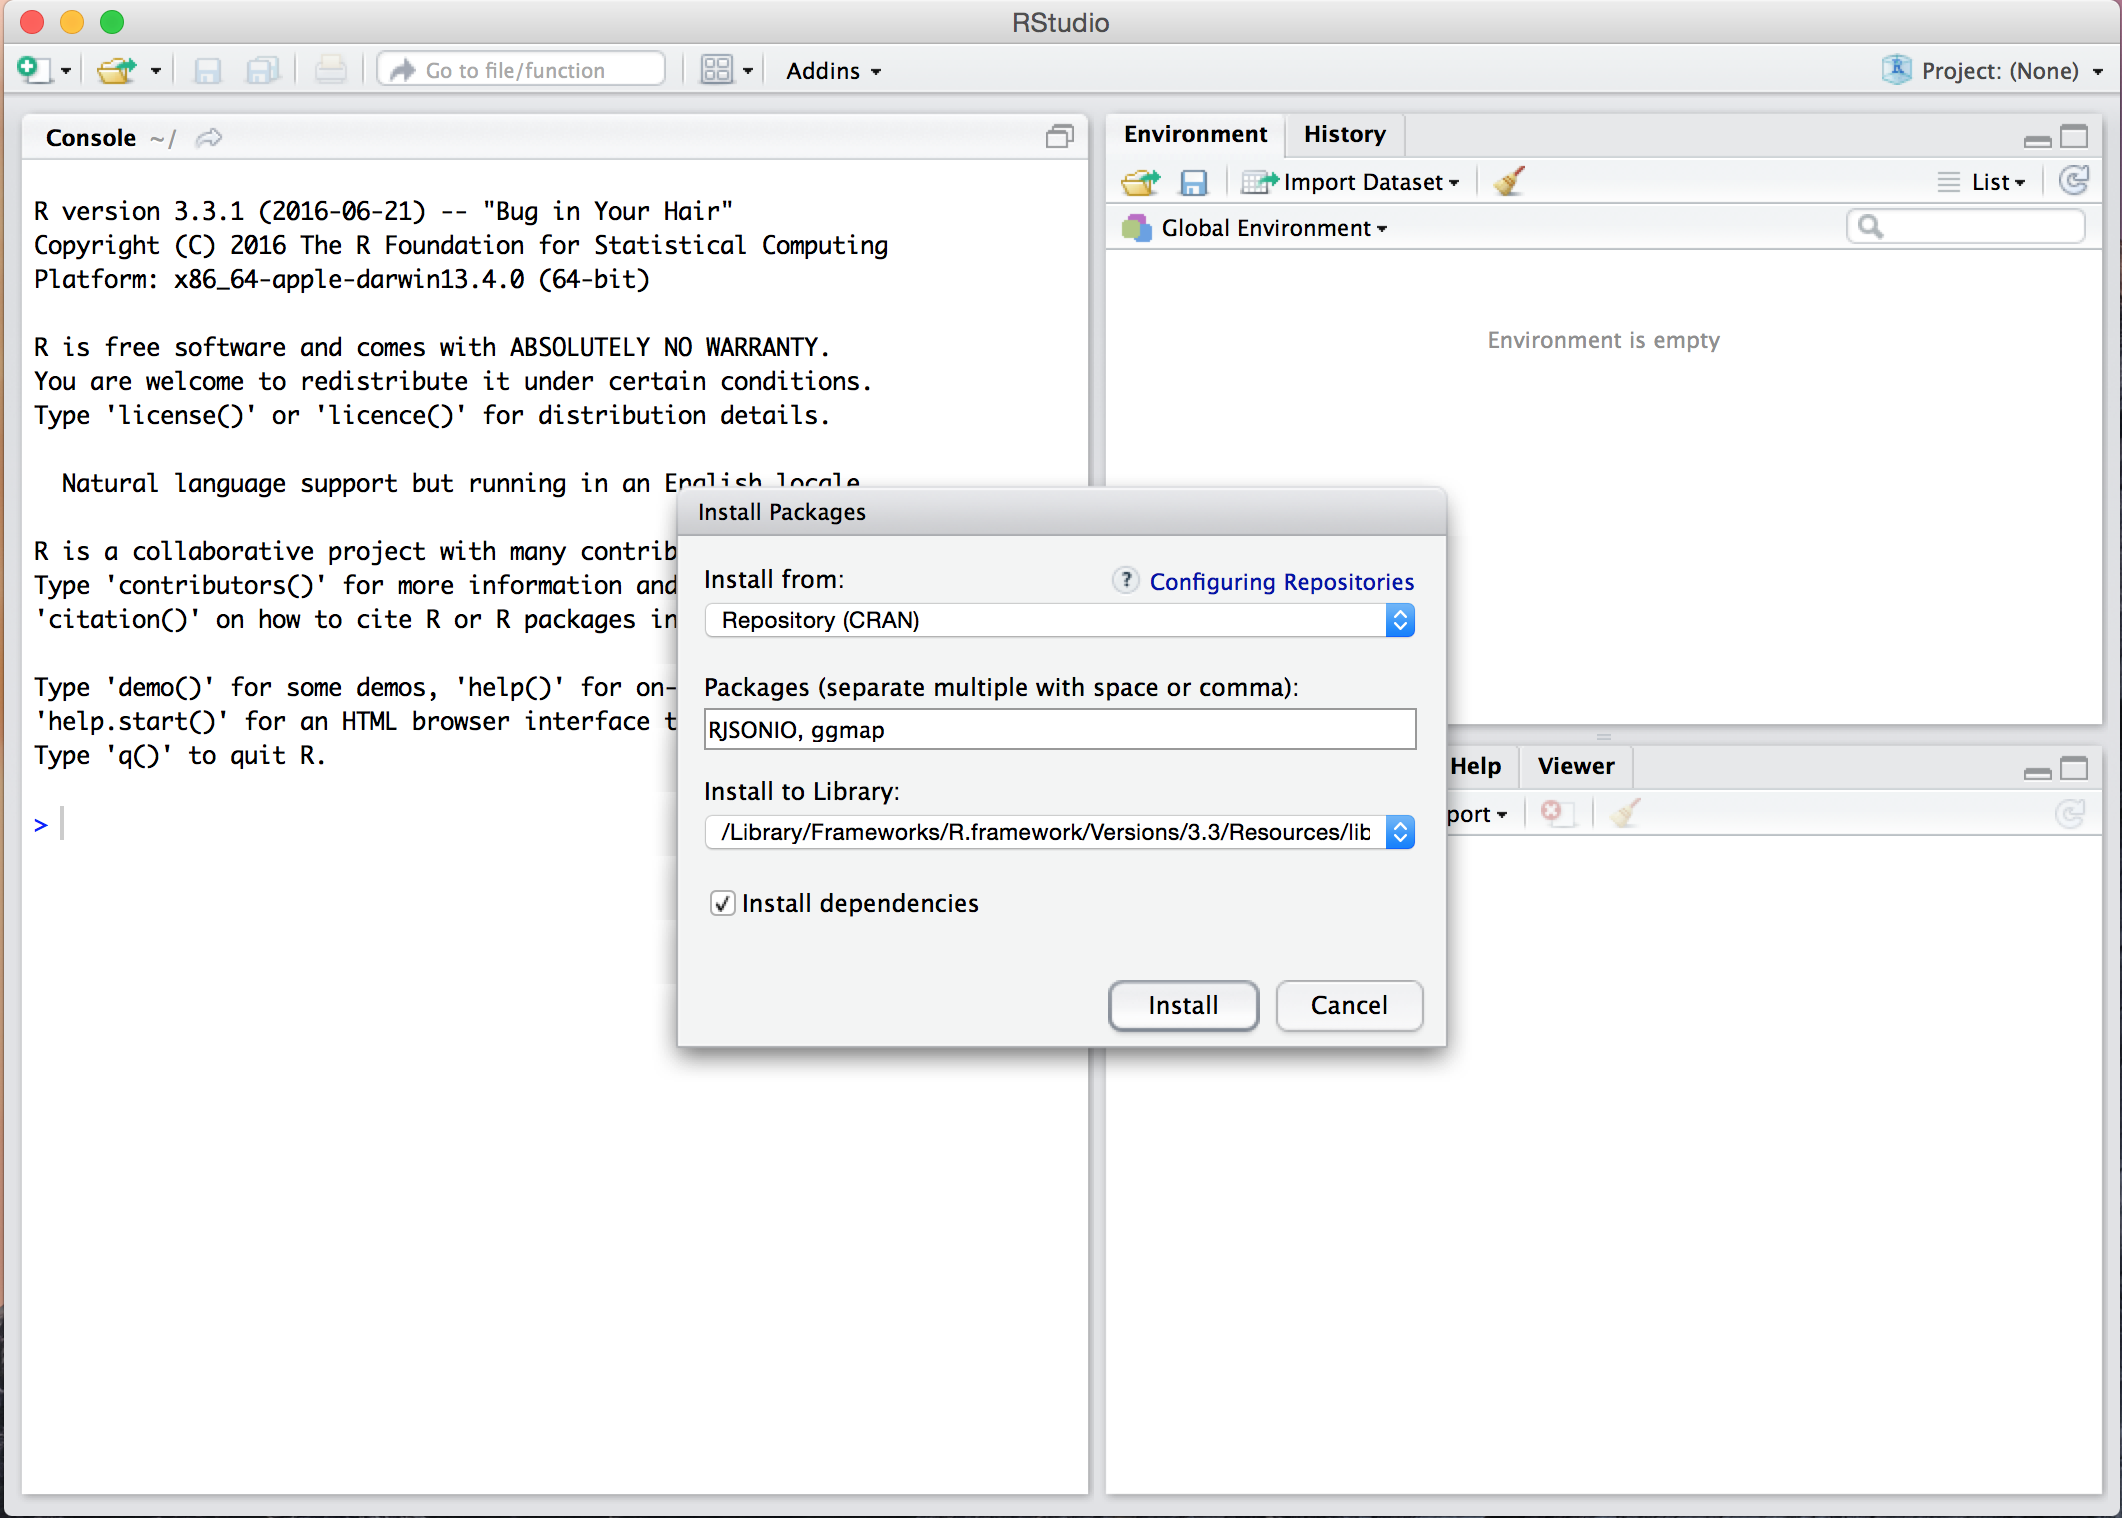
Select Install Packages... from the tools menu. RJSONIO and ggmap packages are required for this example. Add the RJSONIO and ggmap packages to the Packages text box (use a comma separator) and choose Install.
Select Open File... from the File menu. Choose the GetCurrentObsJSON.R file (available for download here). You'll see the R script is now loaded in the top left window.
To run the script, simply highlight all lines in the script and select the run button from the script menu bar.
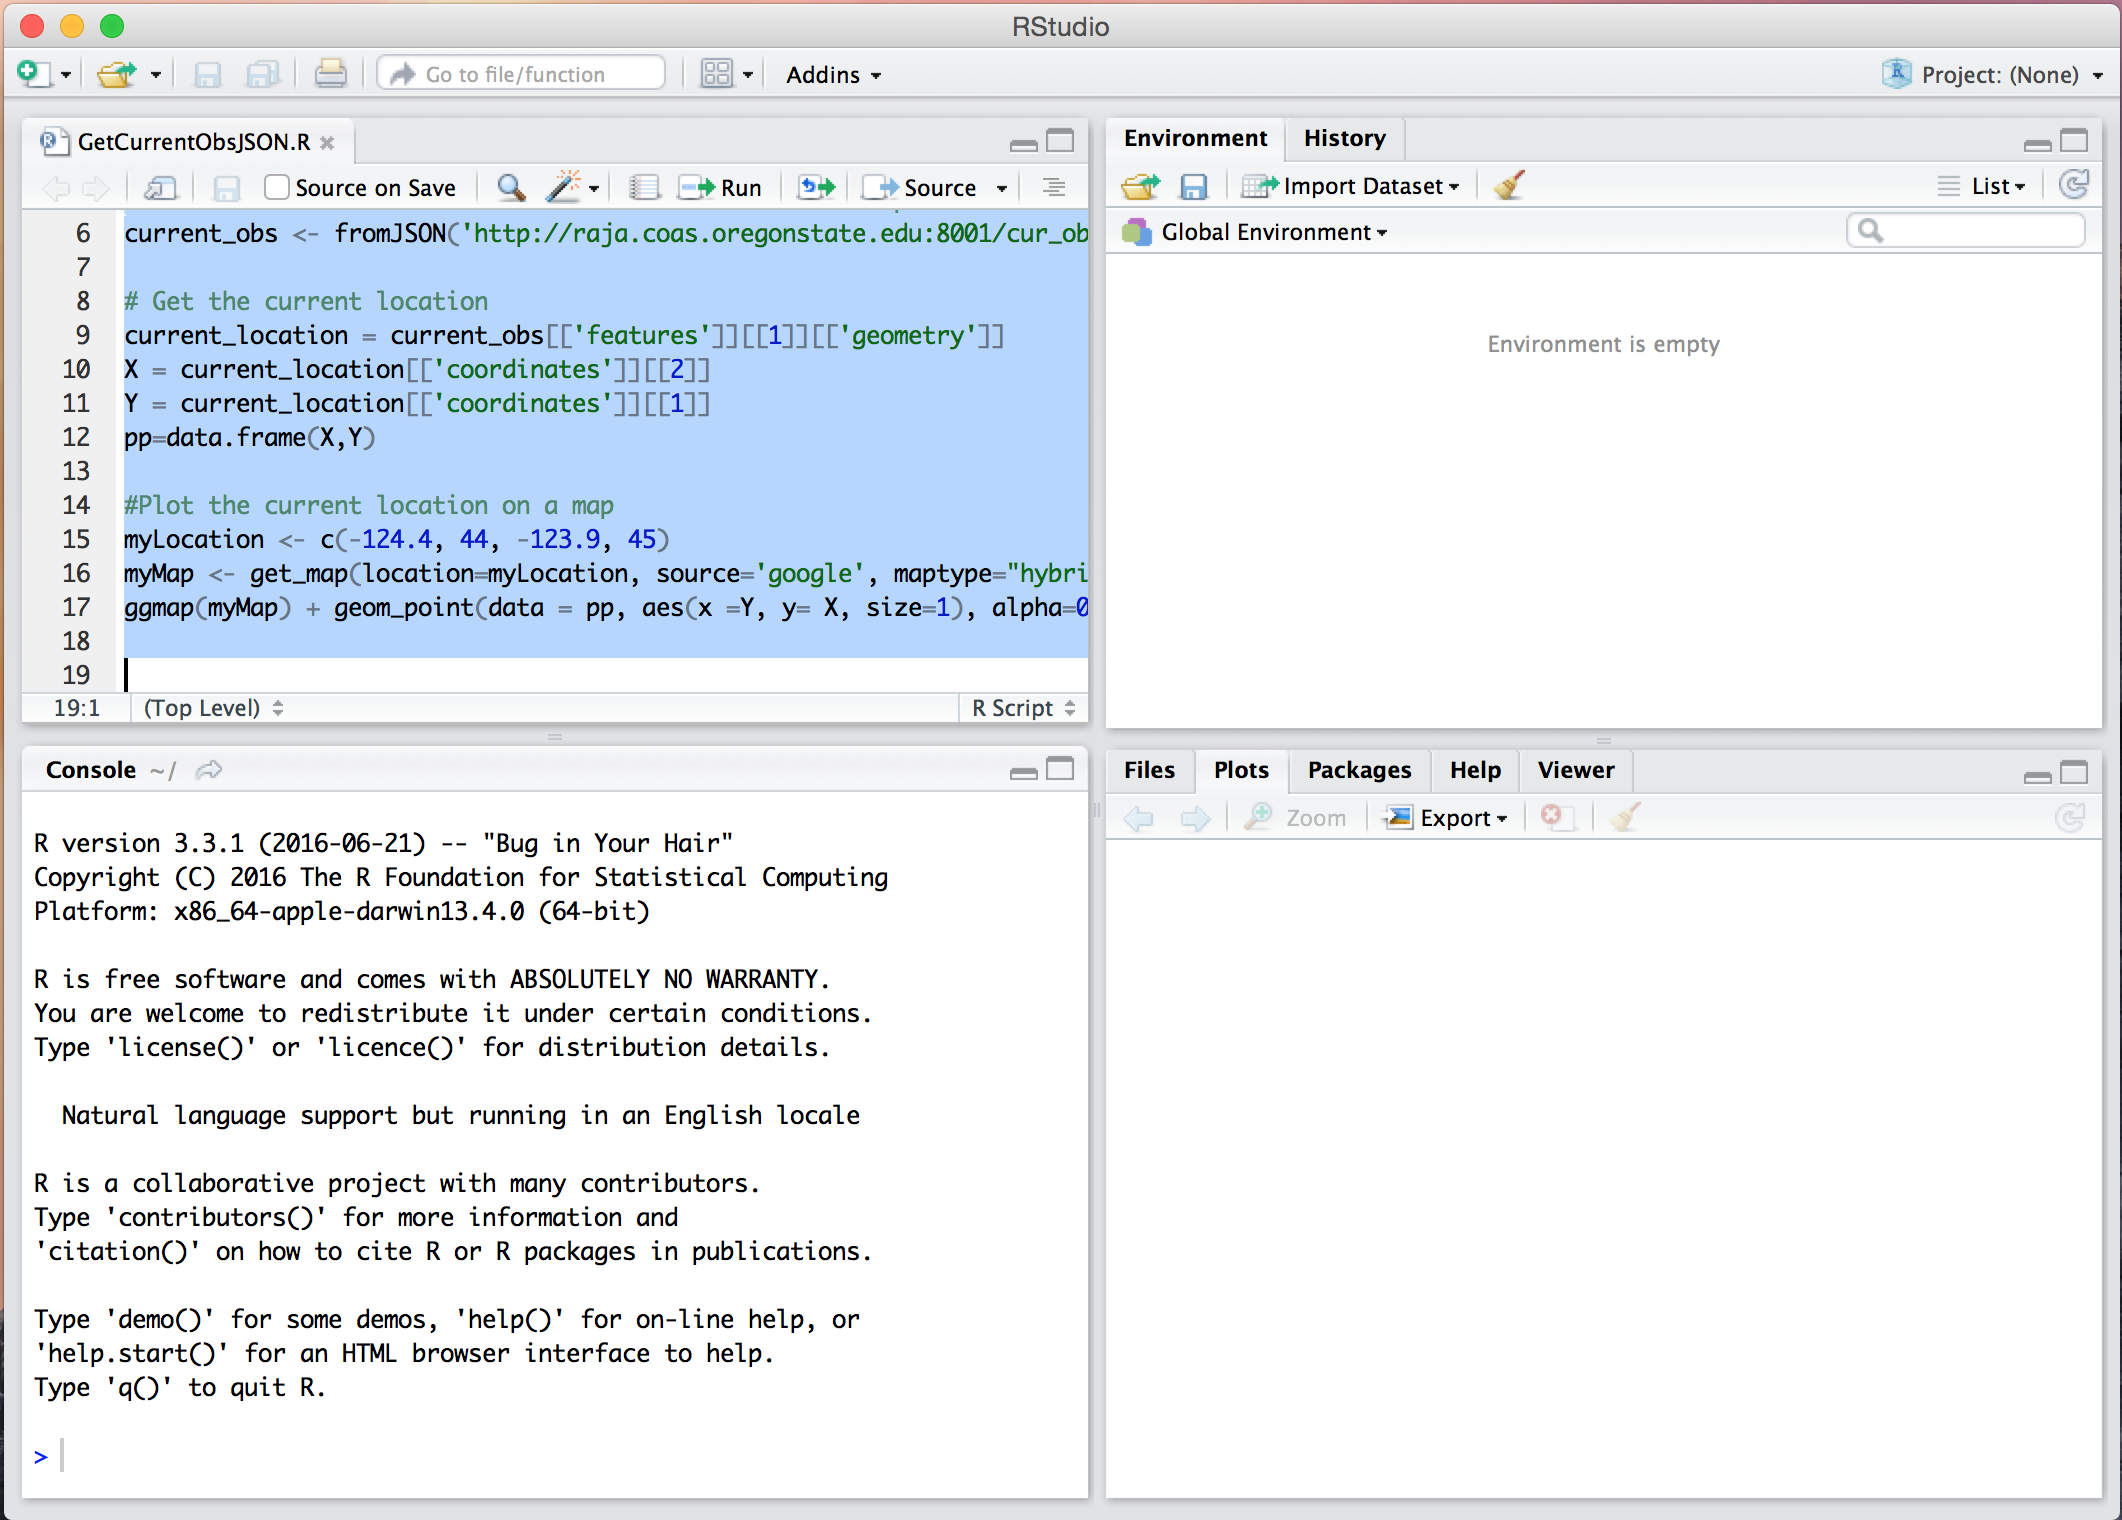
After selecting run, R will download the data in JSON format, extract the position data, make a google map and plot the data point.